On this page
- Pandas
- การติดตั้ง Pandas
- การ Import Pandas
- การสร้าง Pandas Series ด้วย Default Index
- การสร้าง Pandas Series ด้วย Index ที่กำหนดเอง
- การสร้าง Pandas Series จาก Dictionary
- การสร้าง Pandas Series แบบค่าคงที่
- การสร้าง Pandas Series โดยใช้ Linspace
- DataFrames
- การสร้าง DataFrames จาก List of Lists
- การสร้าง DataFrame โดยใช้ Dictionary
- การสร้าง DataFrames จาก List ของ Dictionaries
- การอ่านไฟล์ CSV โดยใช้ Pandas
- การสำรวจข้อมูล
- การแก้ไข DataFrame
- การสร้าง DataFrame
- การเพิ่มคอลัมน์ใหม่
- การแก้ไขค่าในคอลัมน์
- การจัดรูปแบบคอลัมน์ใน DataFrame
- การตรวจสอบ Data Type ของค่าในคอลัมน์
- Boolean Indexing
- แบบฝึกหัด: วันที่ 25
วันที่ 25 — Pandas
เรียน Pandas — ไลบรารีสำหรับ data manipulation ที่ทรงพลังที่สุดใน Python ecosystem

Pandas
Pandas เป็น open source library ที่มีประสิทธิภาพสูง ใช้งานง่าย สำหรับโครงสร้างข้อมูลและเครื่องมือวิเคราะห์ข้อมูลใน Python Pandas เพิ่มโครงสร้างข้อมูลและเครื่องมือที่ออกแบบมาเพื่อทำงานกับข้อมูลแบบตาราง ได้แก่ Series และ Data Frames Pandas มีเครื่องมือสำหรับการจัดการข้อมูล:
- reshaping
- merging
- sorting
- slicing
- aggregation
- imputation
ถ้าคุณใช้ anaconda อยู่แล้ว ไม่จำเป็นต้องติดตั้ง pandas เพิ่มเติม
การติดตั้ง Pandas
สำหรับ Mac:
pip install conda
conda install pandas
สำหรับ Windows:
pip install conda
pip install pandas
โครงสร้างข้อมูลของ Pandas อิงจาก Series และ DataFrames
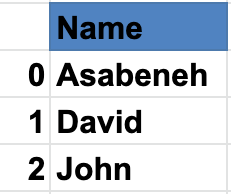
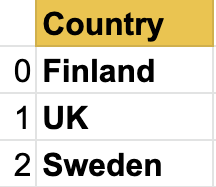
Series คือ column และ DataFrame คือตาราง multidimensional ที่ประกอบด้วย Series หลายชุด ในการสร้าง pandas series เราควรใช้ numpy เพื่อสร้าง array หนึ่งมิติ หรือใช้ python list มาดูตัวอย่างของ series:
Names Pandas Series
Countries Series
Cities Series
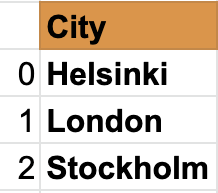
ดังที่เห็น pandas series คือข้อมูลเพียงหนึ่งคอลัมน์ ถ้าต้องการหลายคอลัมน์ เราใช้ data frames ตัวอย่างด้านล่างแสดง pandas DataFrames
มาดูตัวอย่าง pandas data frame:
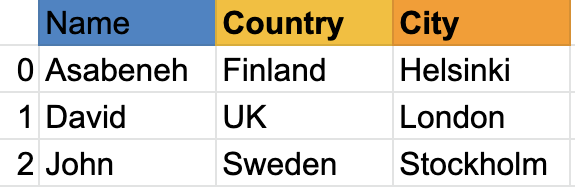
Data frame คือชุดของแถวและคอลัมน์ ดูตารางด้านล่าง มีคอลัมน์มากกว่าตัวอย่างข้างบนมาก:
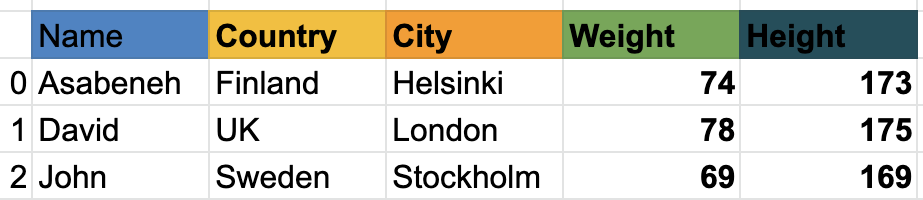
ต่อไป เราจะดูวิธี import pandas และวิธีสร้าง Series และ DataFrames โดยใช้ pandas
การ Import Pandas
import pandas as pd # importing pandas as pd
import numpy  as np # importing numpy as np
การสร้าง Pandas Series ด้วย Default Index
nums = [1, 2, 3, 4,5]
s = pd.Series(nums)
print(s) 0 1
1 2
2 3
3 4
4 5
dtype: int64การสร้าง Pandas Series ด้วย Index ที่กำหนดเอง
nums = [1, 2, 3, 4, 5]
s = pd.Series(nums, index=[1, 2, 3, 4, 5])
print(s) 1 1
2 2
3 3
4 4
5 5
dtype: int64fruits = ['Orange','Banana','Mango']
fruits = pd.Series(fruits, index=[1, 2, 3])
print(fruits) 1 Orange
2 Banana
3 Mango
dtype: objectการสร้าง Pandas Series จาก Dictionary
dct = {'name':'Asabeneh','country':'Finland','city':'Helsinki'}s = pd.Series(dct)
print(s) name Asabeneh
country Finland
city Helsinki
dtype: objectการสร้าง Pandas Series แบบค่าคงที่
s = pd.Series(10, index = [1, 2, 3])
print(s) 1 10
2 10
3 10
dtype: int64การสร้าง Pandas Series โดยใช้ Linspace
s = pd.Series(np.linspace(5, 20, 10)) # linspace(starting, end, items)
print(s) 0 5.000000
1 6.666667
2 8.333333
3 10.000000
4 11.666667
5 13.333333
6 15.000000
7 16.666667
8 18.333333
9 20.000000
dtype: float64DataFrames
Pandas data frames สามารถสร้างได้หลายวิธี
การสร้าง DataFrames จาก List of Lists
data = [
    ['Asabeneh', 'Finland', 'Helsink'],
    ['David', 'UK', 'London'],
    ['John', 'Sweden', 'Stockholm']
]
df = pd.DataFrame(data, columns=['Names','Country','City'])
print(df)| Names | Country | City | |
|---|---|---|---|
| 0 | Asabeneh | Finland | Helsink |
| 1 | David | UK | London |
| 2 | John | Sweden | Stockholm |
การสร้าง DataFrame โดยใช้ Dictionary
data = {'Name': ['Asabeneh', 'David', 'John'], 'Country':[
    'Finland', 'UK', 'Sweden'], 'City': ['Helsiki', 'London', 'Stockholm']}
df = pd.DataFrame(data)
print(df)| Name | Country | City | |
|---|---|---|---|
| 0 | Asabeneh | Finland | Helsiki |
| 1 | David | UK | London |
| 2 | John | Sweden | Stockholm |
การสร้าง DataFrames จาก List ของ Dictionaries
data = [
    {'Name': 'Asabeneh', 'Country': 'Finland', 'City': 'Helsinki'},
    {'Name': 'David', 'Country': 'UK', 'City': 'London'},
    {'Name': 'John', 'Country': 'Sweden', 'City': 'Stockholm'}]
df = pd.DataFrame(data)
print(df)| Name | Country | City | |
|---|---|---|---|
| 0 | Asabeneh | Finland | Helsinki |
| 1 | David | UK | London |
| 2 | John | Sweden | Stockholm |
การอ่านไฟล์ CSV โดยใช้ Pandas
ในการดาวน์โหลดไฟล์ CSV ที่ใช้ในตัวอย่างนี้ ใช้ console/command line:
curl -O https://raw.githubusercontent.com/Asabeneh/30-Days-Of-Python/master/data/weight-height.csvวางไฟล์ที่ดาวน์โหลดไว้ใน working directory ของคุณ
import pandas as pd

df = pd.read_csv('weight-height.csv')
print(df)
การสำรวจข้อมูล
มาอ่านแค่ 5 แถวแรกโดยใช้ head()
print(df.head()) # give five rows we can increase the number of rows by passing argument to the head() method| Gender | Height | Weight | |
|---|---|---|---|
| 0 | Male | 73.847017 | 241.893563 |
| 1 | Male | 68.781904 | 162.310473 |
| 2 | Male | 74.110105 | 212.740856 |
| 3 | Male | 71.730978 | 220.042470 |
| 4 | Male | 69.881796 | 206.349801 |
มาสำรวจบันทึกท้ายสุดของ dataframe โดยใช้ method tail() ด้วย
print(df.tail()) # tails give the last five rows, we can increase the rows by passing argument to tail method| Gender | Height | Weight | |
|---|---|---|---|
| 9995 | Female | 66.172652 | 136.777454 |
| 9996 | Female | 67.067155 | 170.867906 |
| 9997 | Female | 63.867992 | 128.475319 |
| 9998 | Female | 69.034243 | 163.852461 |
| 9999 | Female | 61.944246 | 113.649103 |
ดังที่เห็น ไฟล์ csv มีสามคอลัมน์ ได้แก่ Gender, Height และ Weight ถ้า DataFrame มีคอลัมน์มาก อาจรู้คอลัมน์ทั้งหมดได้ยาก ดังนั้นเราควรใช้ method เพื่อดูชื่อคอลัมน์ทั้งหมด เราไม่รู้จำนวนแถว มาใช้ method shape กัน
print(df.shape) # as you can see 10000 rows and three columns (10000, 3)มาดูคอลัมน์ทั้งหมดโดยใช้ columns
print(df.columns) Index(['Gender', 'Height', 'Weight'], dtype='object')ตอนนี้ มาดึงคอลัมน์เฉพาะโดยใช้ key ของคอลัมน์
heights = df['Height'] # this is now a seriesprint(heights) 0 73.847017
1 68.781904
2 74.110105
3 71.730978
4 69.881796
...
9995 66.172652
9996 67.067155
9997 63.867992
9998 69.034243
9999 61.944246
Name: Height, Length: 10000, dtype: float64weights = df['Weight'] # this is now a seriesprint(weights) 0 241.893563
1 162.310473
2 212.740856
3 220.042470
4 206.349801
...
9995 136.777454
9996 170.867906
9997 128.475319
9998 163.852461
9999 113.649103
Name: Weight, Length: 10000, dtype: float64print(len(heights) == len(weights)) Truemethod describe() ให้ค่าสถิติเชิงพรรณนาของ dataset
print(heights.describe()) # give statistical information about height data count 10000.000000
mean 66.367560
std 3.847528
min 54.263133
25% 63.505620
50% 66.318070
75% 69.174262
max 78.998742
Name: Height, dtype: float64print(weights.describe()) count 10000.000000
mean 161.440357
std 32.108439
min 64.700127
25% 135.818051
50% 161.212928
75% 187.169525
max 269.989699
Name: Weight, dtype: float64print(df.describe()) # describe can also give statistical information from a dataFrame| Height | Weight | |
|---|---|---|
| count | 10000.000000 | 10000.000000 |
| mean | 66.367560 | 161.440357 |
| std | 3.847528 | 32.108439 |
| min | 54.263133 | 64.700127 |
| 25% | 63.505620 | 135.818051 |
| 50% | 66.318070 | 161.212928 |
| 75% | 69.174262 | 187.169525 |
| max | 78.998742 | 269.989699 |
คล้ายกับ describe() method info() ก็ให้ข้อมูลเกี่ยวกับ dataset เช่นกัน
การแก้ไข DataFrame
การแก้ไข DataFrame:
- เราสามารถสร้าง DataFrame ใหม่ได้
- เราสามารถสร้างคอลัมน์ใหม่แล้วเพิ่มลงใน DataFrame
- เราสามารถลบคอลัมน์ที่มีอยู่ออกจาก DataFrame
- เราสามารถแก้ไขคอลัมน์ที่มีอยู่ใน DataFrame
- เราสามารถเปลี่ยน data type ของค่าในคอลัมน์ใน DataFrame ได้
การสร้าง DataFrame
เสมอ เราต้อง import package ที่จำเป็นก่อน ตอนนี้ มา import pandas และ numpy สองเพื่อนซี้กัน
import pandas as pd
import numpy as np
data = [
    {"Name": "Asabeneh", "Country":"Finland","City":"Helsinki"},
    {"Name": "David", "Country":"UK","City":"London"},
    {"Name": "John", "Country":"Sweden","City":"Stockholm"}]
df = pd.DataFrame(data)
print(df)| Name | Country | City | |
|---|---|---|---|
| 0 | Asabeneh | Finland | Helsinki |
| 1 | David | UK | London |
| 2 | John | Sweden | Stockholm |
การเพิ่มคอลัมน์ใน DataFrame ก็เหมือนการเพิ่ม key ใน dictionary
ก่อนอื่น มาใช้ตัวอย่างก่อนหน้านี้เพื่อสร้าง DataFrame หลังจากที่สร้าง DataFrame แล้ว เราจะเริ่มแก้ไขคอลัมน์และค่าในคอลัมน์
การเพิ่มคอลัมน์ใหม่
มาเพิ่มคอลัมน์ weight ใน DataFrame
weights = [74, 78, 69]
df['Weight'] = weights
df| Name | Country | City | Weight | |
|---|---|---|---|---|
| 0 | Asabeneh | Finland | Helsinki | 74 |
| 1 | David | UK | London | 78 |
| 2 | John | Sweden | Stockholm | 69 |
มาเพิ่มคอลัมน์ height ใน DataFrame ด้วย
heights = [173, 175, 169]
df['Height'] = heights
print(df)| Name | Country | City | Weight | Height | |
|---|---|---|---|---|---|
| 0 | Asabeneh | Finland | Helsinki | 74 | 173 |
| 1 | David | UK | London | 78 | 175 |
| 2 | John | Sweden | Stockholm | 69 | 169 |
ดังที่เห็นใน DataFrame ด้านบน เราได้เพิ่มคอลัมน์ใหม่ Weight และ Height แล้ว มาเพิ่มคอลัมน์เพิ่มเติมชื่อ BMI (Body Mass Index) โดยคำนวณจากมวลและส่วนสูง BMI คือมวลหารด้วยส่วนสูงยกกำลังสอง (เป็นเมตร) — Weight/Height * Height
ดังที่เห็น ส่วนสูงอยู่ในหน่วยเซนติเมตร เราจึงต้องเปลี่ยนเป็นเมตร มาแก้ไขแถว height กัน
การแก้ไขค่าในคอลัมน์
df['Height'] = df['Height'] * 0.01
df| Name | Country | City | Weight | Height | |
|---|---|---|---|---|---|
| 0 | Asabeneh | Finland | Helsinki | 74 | 1.73 |
| 1 | David | UK | London | 78 | 1.75 |
| 2 | John | Sweden | Stockholm | 69 | 1.69 |
# Using functions makes our code clean, but you can calculate the bmi without one
def calculate_bmi ():
    weights = df['Weight']
    heights = df['Height']
    bmi = []
    for w,h in zip(weights, heights):
        b = w/(h*h)
        bmi.append(b)
    return bmi

bmi = calculate_bmi()df['BMI'] = bmi
df| Name | Country | City | Weight | Height | BMI | |
|---|---|---|---|---|---|---|
| 0 | Asabeneh | Finland | Helsinki | 74 | 1.73 | 24.725183 |
| 1 | David | UK | London | 78 | 1.75 | 25.469388 |
| 2 | John | Sweden | Stockholm | 69 | 1.69 | 24.158818 |
การจัดรูปแบบคอลัมน์ใน DataFrame
ค่า BMI ใน DataFrame เป็น float ที่มีทศนิยมหลายตำแหน่ง มาเปลี่ยนให้เหลือทศนิยมหนึ่งตำแหน่ง
df['BMI'] = round(df['BMI'], 1)
print(df)| Name | Country | City | Weight | Height | BMI | |
|---|---|---|---|---|---|---|
| 0 | Asabeneh | Finland | Helsinki | 74 | 1.73 | 24.7 |
| 1 | David | UK | London | 78 | 1.75 | 25.5 |
| 2 | John | Sweden | Stockholm | 69 | 1.69 | 24.2 |
ข้อมูลใน DataFrame ยังไม่สมบูรณ์ มาเพิ่มคอลัมน์ปีเกิดและปีปัจจุบัน
birth_year = ['1769', '1985', '1990']
current_year = pd.Series(2020, index=[0, 1,2])
df['Birth Year'] = birth_year
df['Current Year'] = current_year
df| Name | Country | City | Weight | Height | BMI | Birth Year | Current Year | |
|---|---|---|---|---|---|---|---|---|
| 0 | Asabeneh | Finland | Helsinki | 74 | 1.73 | 24.7 | 1769 | 2020 |
| 1 | David | UK | London | 78 | 1.75 | 25.5 | 1985 | 2020 |
| 2 | John | Sweden | Stockholm | 69 | 1.69 | 24.2 | 1990 | 2020 |
การตรวจสอบ Data Type ของค่าในคอลัมน์
print(df.Weight.dtype) dtype('int64')df['Birth Year'].dtype # it gives string object , we should change this to numberdf['Birth Year'] = df['Birth Year'].astype('int')
print(df['Birth Year'].dtype) # let's check the data type now dtype('int32')ตอนนี้ทำเช่นเดียวกันสำหรับ current year:
df['Current Year'] = df['Current Year'].astype('int')
df['Current Year'].dtype dtype('int32')ตอนนี้ค่าในคอลัมน์ปีเกิดและปีปัจจุบันเป็น integer แล้ว เราสามารถคำนวณอายุได้
ages = df['Current Year'] - df['Birth Year']
ages 0 251
1 35
2 30
dtype: int32df['Ages'] = ages
print(df)| Name | Country | City | Weight | Height | BMI | Birth Year | Current Year | Ages | |
|---|---|---|---|---|---|---|---|---|---|
| 0 | Asabeneh | Finland | Helsinki | 74 | 1.73 | 24.7 | 1769 | 2019 | 250 |
| 1 | David | UK | London | 78 | 1.75 | 25.5 | 1985 | 2019 | 34 |
| 2 | John | Sweden | Stockholm | 69 | 1.69 | 24.2 | 1990 | 2019 | 29 |
บุคคลในแถวแรกมีอายุถึง 251 ปี ซึ่งเป็นไปได้ยากมากที่ใครจะมีชีวิตอยู่ได้นานขนาดนั้น อาจเป็นการพิมพ์ผิดหรือข้อมูลถูกสร้างขึ้น ดังนั้นมาใส่ค่าเฉลี่ยของคอลัมน์โดยไม่รวม outlier
mean = (35 + 30)/ 2
mean = (35 + 30)/ 2
print('Mean: ',mean) #it is good to add some description to the output, so we know what is what Mean: 32.5Boolean Indexing
print(df[df['Ages'] > 120])| Name | Country | City | Weight | Height | BMI | Birth Year | Current Year | Ages | |
|---|---|---|---|---|---|---|---|---|---|
| 0 | Asabeneh | Finland | Helsinki | 74 | 1.73 | 24.7 | 1769 | 2020 | 251 |
print(df[df['Ages'] < 120])| Name | Country | City | Weight | Height | BMI | Birth Year | Current Year | Ages | |
|---|---|---|---|---|---|---|---|---|---|
| 1 | David | UK | London | 78 | 1.75 | 25.5 | 1985 | 2020 | 35 |
| 2 | John | Sweden | Stockholm | 69 | 1.69 | 24.2 | 1990 | 2020 | 30 |
แบบฝึกหัด: วันที่ 25
- อ่านไฟล์ hacker_news.csv จาก data directory
- ดึง 5 แถวแรก
- ดึง 5 แถวท้าย
- ดึงคอลัมน์ title เป็น pandas series
- นับจำนวนแถวและคอลัมน์
- กรอง title ที่มีคำว่า python